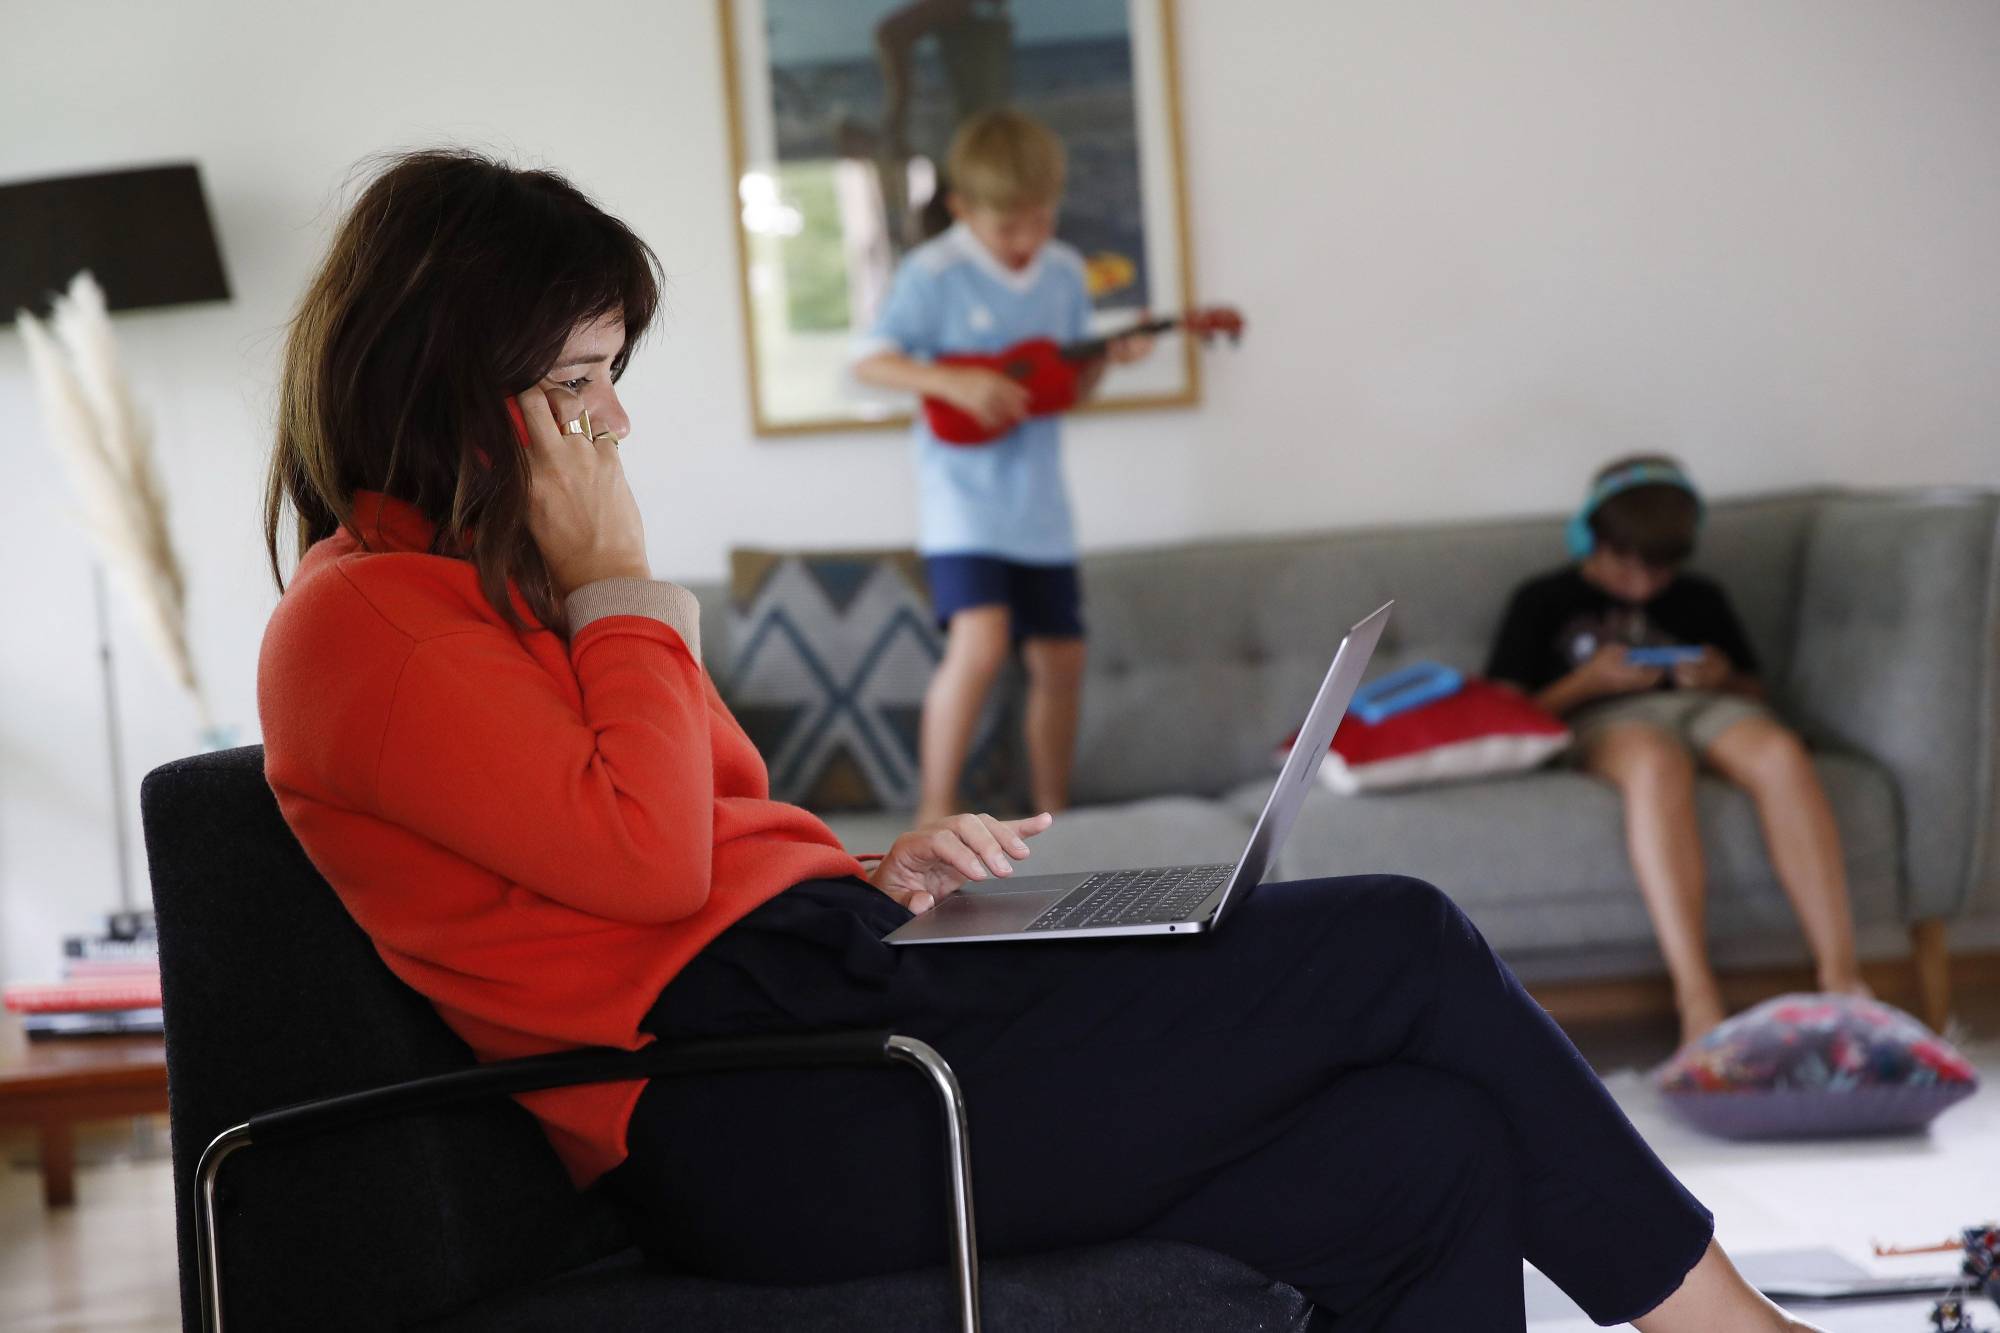
In May, U.S. Census Bureau survey-takers started asking Americans if they were working at home because of the coronavirus, and 35.4 percent of employed persons said yes. That percentage dropped in subsequent months, but as data released as part of Friday’s employment report from the Bureau of Labor Statistics (BLS) indicate, it hasn’t been dropping by all that much lately.
This does not include those who were already working from home before the pandemic. Estimates of the size of this group range from the 5.7 percent of U.S. workers who said they worked at home when the Census Bureau asked them about commuting patterns in 2019 to the upwards of 20 percent who have reported working at home at least some of the time in recent years in two BLS surveys. Yet another survey, conducted in April, found that 14.6 percent of employed persons had already been working at home and 34.1 percent had started doing so because of the pandemic, for a 48.7 percent total — although it’s important to note that huge numbers of people who couldn’t work from home had just been furloughed or laid off, and thus weren’t counted in the denominator.
So one shouldn’t make too much of these exact percentages, which among other things don’t capture what is surely a shifting mix of at-home and office work. I’ve gone from working at home every day this spring and summer to going into the office occasionally, but I would still show up as a work-at-homer in the above chart. But the work-at-home numbers do reveal some important patterns and trends. For example, here are the major occupational categories with the highest percentage of workers reporting that they worked at home in September because of COVID.


 and the staff of Oseto Suisan Fisheries prepare to check on their sustainably farmed fish.")


With your current subscription plan you can comment on stories. However, before writing your first comment, please create a display name in the Profile section of your subscriber account page.